
Theory and computer simulation of permeation
Our peptide permeates only across the plasma membrane of cancer cells and not normal cells. Once inside the cell, it targets the mitochondria and initiates pathways of cell death in the mitochondria.
Computer simulations suggest a permeation mechanism that combines charge and hydrophobic interactions. The outer layer of the cancer cell plasma membrane is highly charged, which facilitates efficient permeation, guided by membrane defects.
Figures: Simulation of peptide permeation
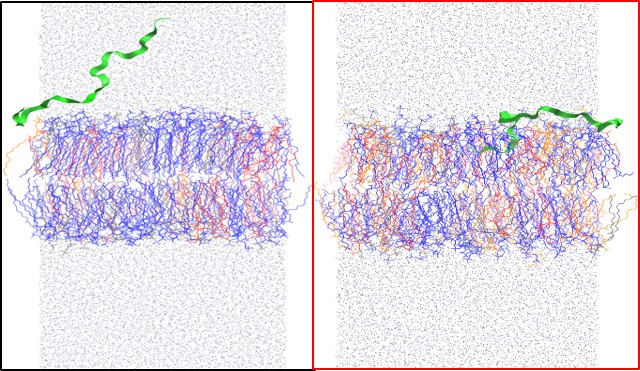
Conventional Molecular Dynamics simulation of the peptide approaches models of cancer and normal membranes. Left panel: peptide (green ribbon) approaching a normal membrane, which is not attractive to the peptide. Right panel: Peptide binds strongly to a model of a cancer membrane.
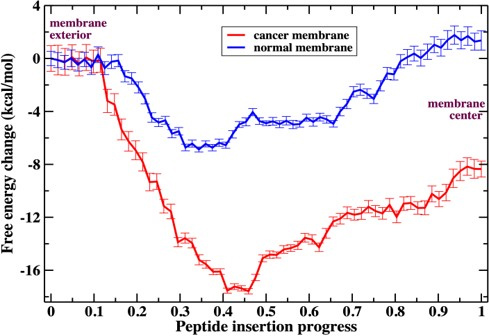
The free energy profiles of the peptide permeation across models of normal and cancer membranes. The atomically detailed simulations were conducted with the Milestoning method for long-time dynamics developed in Elber’s group. Blue curve: The free energy profile of peptide permeation across the normal membrane. Red curve: Permeation across the cancer membrane (red). The aqueous solution is on the left of the panels, and the right side is the center of the membrane. The peptide insertion coordinate is the MaxFlux pathway. Note the deep free-energy minimum found in the cancer membrane, which serves as a trap for the peptide and assists translocation.
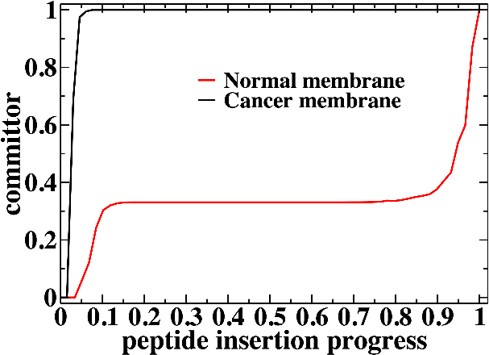
The committor function of peptide permeation across the cancer (black) and normal (red) membranes. The committor at a position x is the probability that the system will transition from x to the product before making it to the reactant. In our case, the product is the center of the membrane and the reactant, the peptide at the water membrane interface. The red curve is the committor for permeation across the cancer membrane, and the blue line is for a healthy membrane. On the left side, we find the aqueous solution, and on the right, the hydrophobic membrane center. Note that the peptide in the cancer membrane is committed (probability 1) to go to the center almost immediately upon entry to the membrane. In contrast, the peptide permeation across the normal membrane is committed very late, close to the membrane center.
Peptide permeation: Experiments
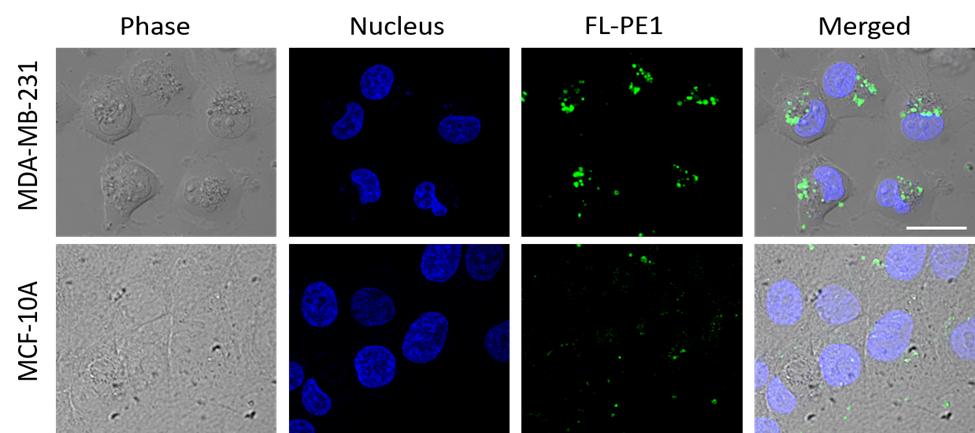
We conduct experiments on peptide permeation across plasma membranes of living cells using fluorescein-labeled peptides (green), tracing peptide movement as a function of space and time.
In the figure below, we show the cells (normal and cancer) in gray, the nucleus in blue, the peptide distribution in green, and the merged picture of the peptide and the cells, last. The first row is for a breast cancer cell, and the second row for normal breast cells. Note that the green is visible only inside the cancer and not in normal cells. The images were taken after six hours.
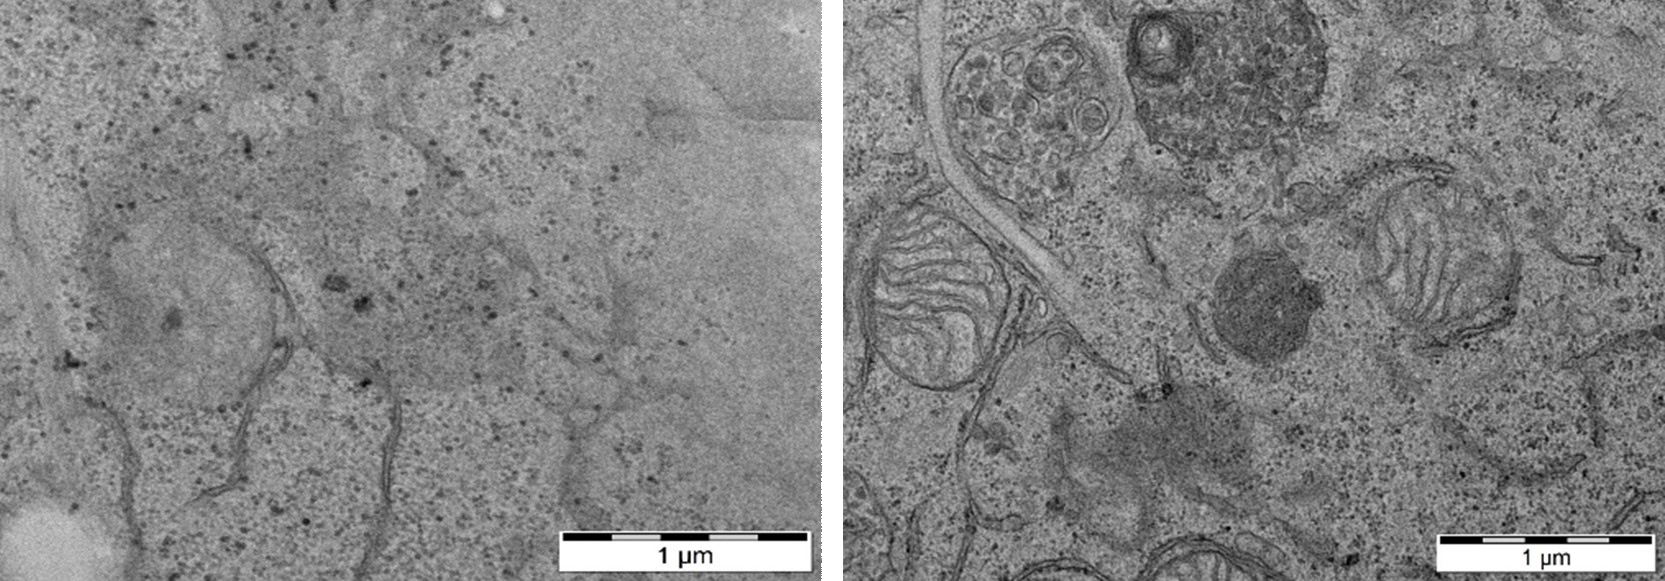
Peptides of the PEX family kill cancer cells by targeting the mitochondria and inducing cell-death pathways. In the Figure below, we show TEM (Transition Electron Microscopy) of pancreatic cancer cells that are treated or untreated with the peptide PE1 of the PEX family. The left image is of damaged mitochondria (red arrows) and the right image is of a reference, cells that were not treated with PE1.
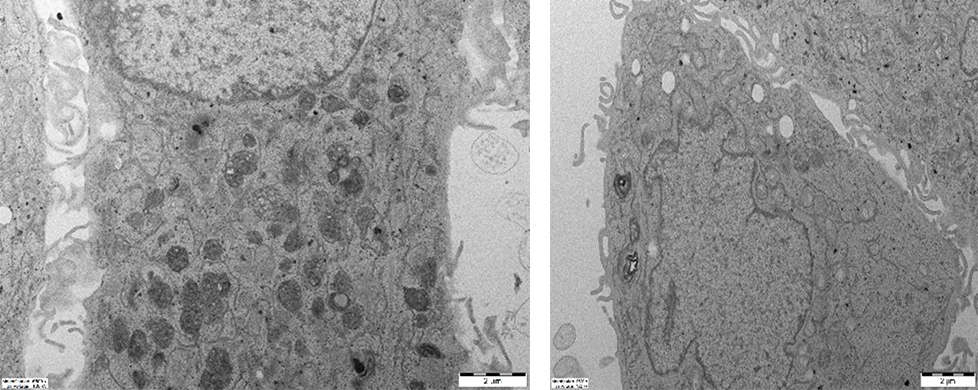
Cancer cells treated with PE1 are killed, as shown in the left TEM image below, with a large number of autophagosomes. No autophagosomes are observed in untreated cancer cells on the right.
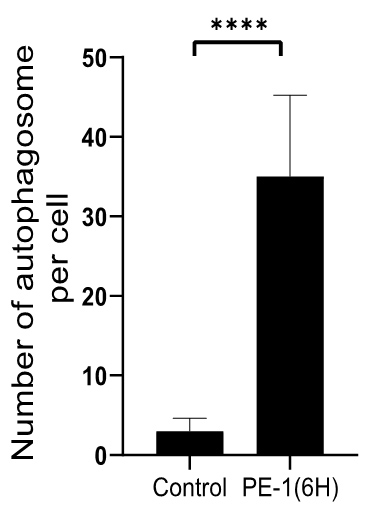
A quantification of the above figure. The number of autophagosomes in cancer cells after six hours of treatment with PE1 is shown in the histogram on the left.
The efficacy of the PEX peptide family is examined against several cancer types in the table below. The first column is the type of cancer considered. The following column is the efficacy of the treatment with members of PEX peptide family (PE1, PE6, PE7, and PE8). The efficacy is measured after three hours of treatment with 20μM (or 10μM for Melanoma). Of the four peptides, PE1 is the most effective. However, PE8 is the best for Melanoma.
Swipe with your finger left/right to see the full table:
| PE1 | PE6 | PE7 | PE8 | |
|---|---|---|---|---|
| Ovarian cancer cells (SKOV-3) |
90% At 20µM of peptide |
50% | 25% | 25% |
| Glioblastoma cells (U87G) | 75% At 20µM of peptide |
60% | 25% | 60% |
| Melanoma cells (A375) | 60% | 50% | 10% | 75% At 10µM of peptide |
| Breast cancer cells (MDA-MB-231) |
85% At 20µM of peptide |
80% | 70% | 75% |
| Pancreas adenocarcinoma (Panc 04.03) |
75% At 10µM of peptide |
75% | 45% | 55% |